Some background information
When using SCOM Gateway Servers you can add a ‘site’ tag to them. This is done when running the Gateway Approval Tool. This site tag can be a pain in some situations but most of the times it can help you to differentiate between multiple environments being monitored by using Gateway Servers.
In situations like these the use of site switches are the way to go, since they add the site tag to all the Alerts coming from all the objects residing behind that particular Gateway Server (or set of Gateway Servers, since you can use the same site switch multiple times, for instance when you run multiple Gateway Servers in failover configuration through PowerShell). So now you can simply filter those Alerts in your Views, Notification Model and Reports.
How about the health status of the Site itself?
Another not so well known feature of Sites are the capability to reflect the health status of the whole environment being covered by that particular Gateway Server (or set of Gateway Servers). Out of the box this isn’t present in SCOM 2012x. By default the Site doesn’t have a status at all:
When you open the Site object in Health Explorer, you won’t see any Monitor at all. So no Monitors = no status.
In SCOM 2007x the status for the Site was only present when you imported the Service Provider MP, a MOM 2005 converted MP that is. This MP enabled monitoring on a Site level enabling the organization to have a quick view of the overall health status of al their sites. But believe me, you don’t want an MP like that in your SCOM 2012x environment…
There is a whole history behind that MP, back to the days where SCOM as a service could be implemented in conjunction with SCE (System Center Essentials). But happily that’s the past and was a bit of a drag (duh!) to implement and maintain. Also the licensing was terrible back then. I won’t bother you with that kind of obsolete knowledge…
With a few mouse clicks this monitor is rebuild in SCOM 2012x, enabling the Site to reflect the overall health status of of all Objects residing behind that Gateway Server (or set of Gateway Servers).
How to build the Rollup Monitor for the Site?
This is really easy. Just follow these steps and you’ll be fine.
- Open the SCOM 2012x Console with SCOM Admin permissions > Authoring > Management Pack Objects > Monitors. Set the scope to Site by using the Change Scope option;
- Expand Site > Entity Health > right click Availability > Create a Monitor > Dependency Rollup Monitor;
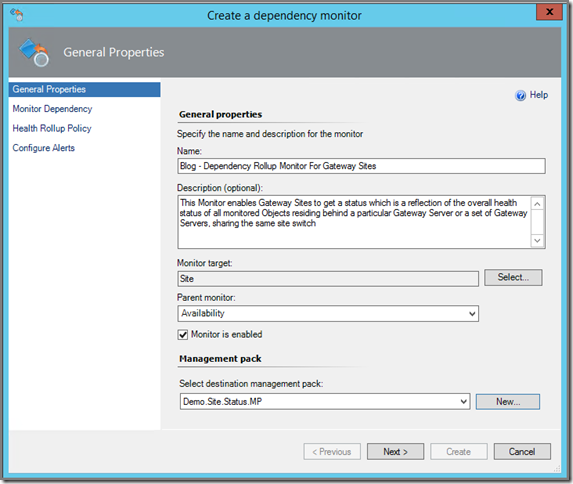
- Give this Monitor a proper name and description. Your screen looks like this now:

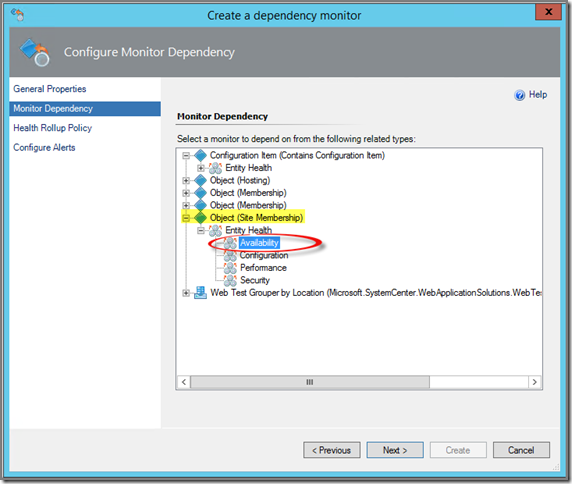
> Next; - Now comes the most important part of it all, the Monitor Dependency. Make sure you select Object (Site Membership) > Entity Health > Availability. Only than the Monitor will work!

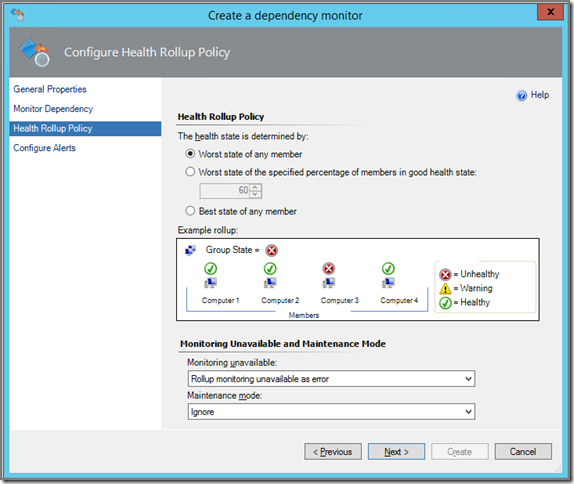
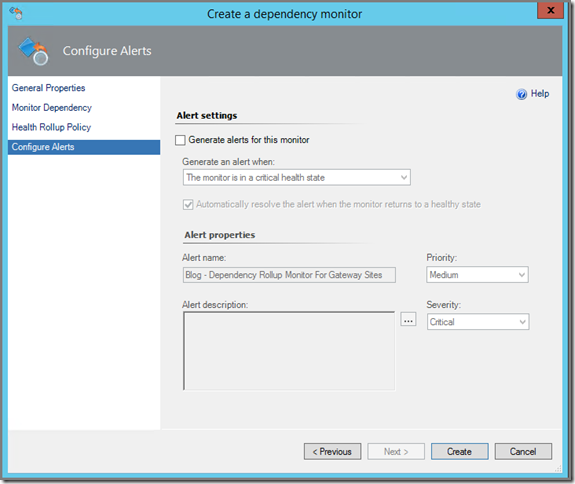
> Next; - For Health Rollup Policy and Configure Alerts it’s best to leave at default settings. You only want a rollup and no extra Alerting nor do you want to the Monitor to reflect anything else besides the worst state of any member:

> Next;
And:
> Create; - The Monitor will be created and now the SCOM Console looks like this:

- Soon the Site objects will get a status in the SCOM Console:

Recap
When monitoring multiple sites residing behind Gateway Servers, the usage of the ‘site’ switch might come in handy. And with some additional click work you enable a health rollup for those same Objects as well. Now with a single glance you can see what the overall health status of ALL monitored objects residing at particular Site is.
No comments:
Post a Comment